Rate Cuts and Risky Bets: When the Fed Rolls Out the Red Carpet🎬 The Fed’s June Meeting Is Around the Corner
Mark your calendars: June 17–18 is when the Federal Reserve's Federal Open Market Committee (FOMC) convenes next. With the benchmark interest rate ECONOMICS:USINTR currently holding steady at 4.25% – 4.50%, investors and policymakers alike are keenl

The best trades require research, then commitment.
Get started for free$0 forever, no credit card needed

Scott "Kidd" PoteetThe unlikely astronaut

Where the world does markets
Join 100 million traders and investors taking the future into their own hands.

Bullish Trigger Hit! Looking For Longs on the S&PLast time we spoke, I mentioned some key levels I wanted to see price drop to before considering a move to the upside. And what do you know — here we are.
In today’s video, I share an update on the trade idea and how we can position ourselves for the next big play.
Walk with me as I break down thi

Does Bitcoin Keep You Up at Night?Just a meme I made this morning.
The Weekly All Time High Breakout has failed, twice, just like 2021...

Nvidia Posts Another Blowout Quarter. What Can Slow It Down?Hint: Not much.
🚀 Earnings So Good You Can’t Ignore ‘Em
Another quarter, another jaw-dropper from Nvidia NVDA . In what has basically become a quarterly ritual at this point (congrats to all who celebrate!), Jensen Huang’s silicon empire posted revenue of $44.1 billion , soaring past the $43.

Gold long again: Completion of Double CombinationYesterday's long gold idea was invalidated and turns out that Gold has decided to do a double combination instead of a single A-B-C correction.
Now that I've seen a completion of a Double Combination, I think it is time to try to long gold again.
The stop is below $3240.

Is Bitcoin Ready for Its Next Leg Up? Here’s What We Know So FarBitcoin BITSTAMP:BTCUSD is so back — not just back like “we recovered the dip,” but back like “new all-time highs, let’s go shopping for Lambos on moons” back.
If you’ve been following our Top Stories coverage, you’ll know that the OG token vaulted past $109,500 last week, then kissed $11

USDJPY – Diverging Policies Drive Yen into Pressure Zone near 14USDJPY – Diverging Policies Drive Yen into Pressure Zone near 144
🌍 Macro Landscape: JPY Stuck Between Two Diverging Forces
In recent weeks, the US dollar has regained strength as the Federal Reserve remains committed to its "higher-for-longer" interest rate stance. On the flip side, the Bank of Jap

Trump Delays Tariffs, but Trade Tensions with EU Are Heating UpDonald Trump is back in headline mode — and this time, the EU is in his crosshairs.
After weeks of relative calm, the US President reignited global trade tensions by announcing a 50% tariff on all EU imports. But in a surprise twist — and in true reality-TV fashion — he’s now pushed the start date

SMR NNE OKLO – Breakout Setup Triggered by Nuclear CatalystNYSE:SMR is lighting up after Trump’s announcement on nuclear energy — and it’s not alone. NYSE:OKLO and NASDAQ:NNE are also setting up, but NYSE:SMR has one of the cleanest breakout structures on the board.
🔹 Catalyst: Trump’s nuclear energy announcement yesterday is putting serious momentu

GOLD Price Analysis: Key Insights for Next Week Trading DecisionGold prices surged last week, ending with a strong 3.9% weekly gain, closing around the $3,365 zone after bouncing back with conviction on Friday. In this video, I break down why gold rallied, what key events influenced price action, and how I’m reading the current chart structure to strategically p

See all editors' picks ideas
EMD Trend [InvestorUnknown]EMD Trend is a dynamic trend-following indicator that utilizes Exponential Moving Deviation (EMD) to build adaptive channels around a selected moving average. Designed for traders who value responsive trend signals with built-in volatility sensitivity, this tool highlights directional bias, market

Bear Market Probability Model# Bear Market Probability Model: A Multi-Factor Risk Assessment Framework
The Bear Market Probability Model represents a comprehensive quantitative framework for assessing systemic market risk through the integration of 13 distinct risk factors across four analytical categories: macroeconomic indic

Range Filter [DW]This is an experimental study designed to filter out minor price action for a clearer view of trends.
Inspired by the QQE's volatility filter, this filter applies the process directly to price rather than to a smoothed RSI.
First, a smooth average price range is calculated for the basis of the fil

Delta Volume Columns Pro [LucF]█ OVERVIEW
This indicator displays volume delta information calculated with intrabar inspection on historical bars, and feed updates when running in realtime. It is designed to run in a pane and can display either stacked buy/sell volume columns or a signal line which can be calculated and dis

BERLIN CandlesA problem with Heikin Ashi is that while it gives you a great overview of overall direction, it is rarely possible to use it as a replacement for normal japanese
candlesticks. The reason for this is that actual price data is lost, since the candles are more akin to a moving average than a different

Support Resistance ChannelsHello All,
For Long time I was planning to make Support/Resistance Channels script, finally I had time and here it is.
How this script works?
- it finds and keeps Pivot Points
- when it found a new Pivot Point it clears older S/R channels then;
- for each pivot point it searches all pivot po

MathSpecialFunctionsConvolve1DLibrary "MathSpecialFunctionsConvolve1D"
Convolution is one of the most important mathematical operations used in signal processing. This simple mathematical operation pops up in many scientific and industrial applications, from its use in a billion-layer large CNN to simple image denoising.
___

ErrorFunctionsLibrary "ErrorFunctions"
A collection of functions used to approximate the area beneath a Gaussian curve.
Because an ERF (Error Function) is an integral, there is no closed-form solution to calculating the area beneath the curve. Meaning all ERFs are approximations; precisely wrong, but mostly a

Trend Volatility Index (TVI)Trend Volatility Index (TVI)
A robust nonparametric oscillator for structural trend volatility detection
⸻
What is this?
TVI is a volatility oscillator designed to measure the strength and emergence of price trends using nonparametric statistics.
It calculates a U-statistic based on the Gini mea

Cointegration Heatmap & Spread Table [EdgeTerminal]The Cointegration Heatmap is a powerful visual and quantitative tool designed to uncover deep, statistically meaningful relationships between assets.
Unlike traditional indicators that react to price movement, this tool analyzes the underlying statistical relationship between two time series and

See all indicators and strategies
News didn't load
Looks like that didn't go very well. Let's try again.
Community trends
WC: 29.80 Target: 1800-2400 MOASS: 47k-100K: Time to FOCUSAs I reminded everyone in the youtube video earlier this week we are dealing with a large Diagonal structure in GME
There is nothing unusual AT ALL about the decline we saw this week
That is the nature of diagonals
Now we seem to be bottoming again around 30 which if that continues should see pri

TSLA Honey Ticking Bull Trap!TSLA has a beautiful big ars bear flag! While it should have broken down to trigger a short trade, it decided to Honey Tick people right into a Trap!
It formed a perfect MEGAPHONE in wave 3 up that has now CRACKED! This is a much juicer short setup with the potential of collapsing from here and tak

Dark Pools Explained in Detail and answers to questions.In this discussion you will learn more about how Dark Pool Buy Side Institutions actually work and how they buy stocks in a slow steady accumulation mode based on where fundamentals are in relation to the stock price.
Dark Pools are the Alternative Trading System Venues that are unlit, meaning there

$AI is setting up for a 30% move!C3.AI - NYSE:AI Trade Setup
Inverse H&S Breakout that is now retesting.
A bounce here would confirm the breakout and lead to a MM up to $32.59 for a 30% move!

AAPL: Key Levels to Watch for Price DevelopmentAAPL: Key Levels to Watch for Price Development
Apple's stock (AAPL) has been range-bound between $193 and $212.50 for the past two months, repeatedly testing support near $193 on three occasions.
Each time, the price has rebounded strongly, pushing back toward $212.50—the upper boundary of this

PLTR 1D — When the tea is brewed and the handle’s in placePalantir’s daily chart is shaping up a textbook cup with handle pattern — one of the most reliable continuation setups in technical analysis. The cup base was formed over several months and transitioned into a consolidation phase, building a rectangle structure where smart money likely accumulat

GME Repeating Pattern Reloaded - The 2025 GME Squeeze TrackerI believe that GME has a repeating pattern that occurs from time to time. In this case, it is very special because the pattern signals a squeeze. This project tracks this repeating pattern in an effort to predict the general date range of the next GME squeeze.
Three GME squeezes have occurred and w

nvo bullish long Long Setup Idea – Not Financial Advice - AH
This is a long trade setup based on my personal analysis.
The entry, stop-loss, and target levels are outlined for educational and illustrative purposes only.
📈 Entry:
🛑 Stop Loss:
🎯 Target(s):
Disclaimer:
I am not a financial advisor. This idea i

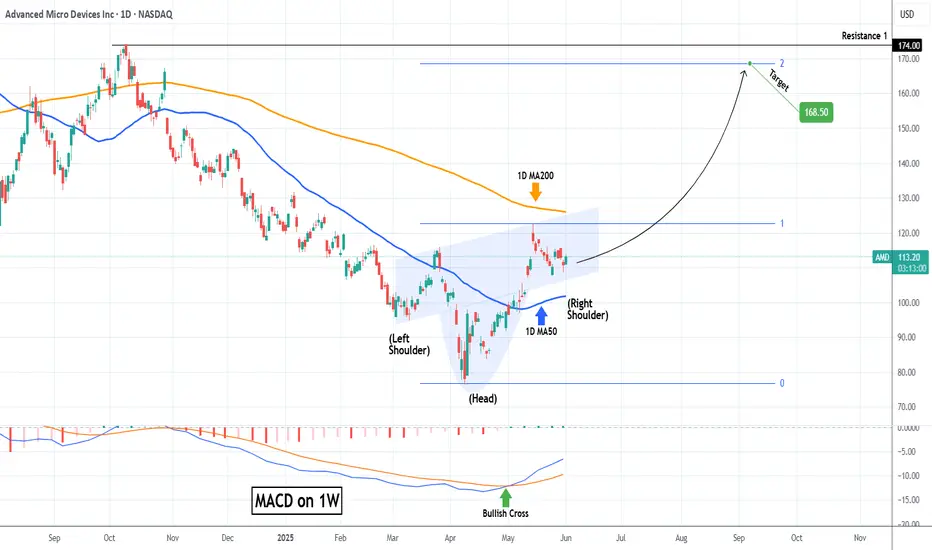
AMD Inverse Head and Shoulders waiting for massive break-out.Advanced Micro Devices (AMD) has entered a wide consolidation range within the 1D MA50 (blue trend-line) and 1D MA200 (orange trend-line) following the May 14 High. From a wider scale, this is technically seen as the Right Shoulder of an Inverse Head and Shoulders (IH&S) pattern.
This is generally
Trade of the week: $TSLA (Short)Trade of the week: NASDAQ:TSLA (Short)
Current price: $346
Entry Trigger:$339
Stoploss: $353
Call option: NASDAQ:TSLA $300 put expiry 06/20 at $4.45(*1 Contract only)
Thesis: NASDAQ:TSLA is in daily uprising channel aka building a wedge. NASDAQ:TSLA last week made a doji candle on weekly of

See all stocks ideas
Today
DCIDonaldson Company, Inc.
Actual
—
Estimate
0.95
USD
Today
CTRNCiti Trends, Inc.
Actual
—
Estimate
−0.20
USD
Today
FERGFerguson Enterprises Inc.
Actual
—
Estimate
2.01
USD
Today
DGDollar General Corporation
Actual
—
Estimate
1.48
USD
Today
SIGSignet Jewelers Limited
Actual
—
Estimate
1.00
USD
Today
OLLIOllie's Bargain Outlet Holdings, Inc.
Actual
—
Estimate
0.71
USD
Today
CRMTAmerica's Car-Mart, Inc.
Actual
—
Estimate
0.86
USD
Today
PODCPodcastOne, Inc.
Actual
—
Estimate
−0.03
USD
See more events
News didn't load
Looks like that didn't go very well. Let's try again.
Community trends
Bitcoin - 97,665 soon! Big drop on altcoins... (Buy here)I hope you sold in May and went away, as I recommended in my previous posts! If not, you probably wonder why Bitcoin is going down.
From a technical point of view, Bitcoin is breaking down out of the ascending parallel channel of the main uptrend from 74k to 112k. This is huge! Altcoins are alread

Bitcoin may break support level and continue to fall in channelHello traders, I want share with you my opinion about Bitcoin. Previously, price was moving inside a horizontal range, consolidating between resistance and the buyer zone near 103500 - 102900. The market lacked clear direction, and price repeatedly rebounded within this structure, failing to build s

Bitcoin’s Rally Fades Below Resistances — Bearish Wave Setup!Bitcoin ( BINANCE:BTCUSDT ) started to fall as I expected in the previous idea , but failed to break the Heavy Resistance zone($110,000-$105,820) .
Bitcoin is trading near the Resistance zone($107,520-$105,940) , Cumulative Short Liquidation Leverage($106,720-$105,948) , and the Resistance

Bitcoin Daily: It Will Go Lower, I Will Explain WhyIt is hard to make these predictions because there are so many different points of view, so many opinions. There is so much data available that one can easily become confused. We can write an entire book about Bitcoin's next move and still not know what will happen next. I will keep it simple and st

BTCUSD NEXT MOVE (EXPECTING MILD BEARISH)(02-06-2025)Go through the analysis carefully, and do trade accordingly.
Anup 'BIAS for BTCUSD (02-06-2025) (SHORT TERM)
Current price- 104500
"if Price stay below 1,07,000 then next target is 1,03500, 1,02500 and 1,00000 above that 1,11,000.
-POSSIBILITY-1
Wait (as geopolitical situation are worsening )
-

BTCUSD..Chart pattern..Trade Setup (Short / Sell BTCUSD)
Entry: 105,000
Resistance (Potential Invalidator): 109,000
Take Profit (TP):
1st Target: 96,000
2nd Target: 92,000
No stop loss specified — it's essential to define one for risk management. A common approach is placing SL just above resistance (e.g., 109,500 or

TradeCityPro | FET: Bullish Weakness Near Key Support Zone👋 Welcome to TradeCity Pro!
In this analysis, I’ll be reviewing the FET coin — one of the popular projects in the AI space.
✔️ This project’s token currently holds a market cap of $1.75 billion and ranks 48th on CoinMarketCap.
⏳ 4-Hour Timeframe
On the 4-hour chart, we can see an uptrend in place.

Lingrid | BTCUSDT All-Time High Level Retest Long SetupBINANCE:BTCUSDT is holding above the $103,500 support area after a textbook pullback from the higher high at the resistance ceiling. The price is respecting the upward channel and bouncing near the lower boundary, suggesting renewed bullish intent. A reclaim of the $106,000 zone could trigger cont

SYRUP PERPETUAL TRADE , Sold From $0.41200SYRUP PERPETUAL TRADE
SYRUP SELL SETUP
Currently $0.41200
Sold From $0.41200
(Trading plan If SYRUP go up to $0.44
will add more shorts)
Expecting target $0.39400 OR DOWN
In the event of an early exit,
this analysis will be updated.
Its not a Financial advice

BTC: Both Scenarios Explained - Still BearishBTC: Both Scenarios Explained - Still Bearish
From our previous analysis, BTC fell by almost 2.7%.
Today the price stood again at 106K showing a slight upward momentum, but as we can see, everything disappeared.
The price created and corrected ABC with the current data and if this correction has

See all crypto ideas
News didn't load
Looks like that didn't go very well. Let's try again.
Lingrid | GOLD Weekly MARKET Update: Price Coiled for Major Move OANDA:XAUUSD has formed an inside bar pattern on the monthly timeframe, creating a high-probability setup for the next major directional move. May's candle sits completely within April's range, with this compression typically preceding explosive moves in either direction. The 4H chart shows a com

GOLD conditions seem to remain bearish: Pay attention to hintsFor now, we can see that Gold’s bullish momentum has stalled and since Friday Gold has been under pressure from 3325. Not surprisingly though, the market structure performed as expected this past week.
I believe that short-term price action in gold may remain choppy next week due to Trump’s tempora

GOLD → Correction after distribution. Bullish trendFX:XAUUSD is testing the liquidity zone at 3350 and forming a false breakout of resistance within the uptrend. A correction is possible before growth continues.
The fundamental background is quite controversial in the market. In the current situation, the focus is on relations between Russia

Here's a weekly buy-side analysis🟢 Bias: Bullish (Buy)
Gold remains in a long-term uptrend, with fundamental and technical factors supporting continued upside.
50 & 100 EMA: Price is well above both EMAs, confirming bullish momentum.
RSI: Around 60–70 on the weekly; no bearish divergence yet.
MACD: Histogram ticking upward with bu

XAUUSD Analysis Today: Technical and Order Flow !In this video I will be sharing my XAUUSD analysis today, by providing my complete technical and order flow analysis, so you can watch it to possibly improve your forex trading skillset. The video is structured in 3 parts, first I will be performing my complete technical analysis, then I will be mov

GOLD ROUTE MAP UPDATEHey Everyone,
Great start to the week with our chart idea playing out as analysed.
We started the day with our Bullish target hit at 3305 followed with ema5 cross and lock confirmation for 3334, which was hit perfectly with a further lock opening 3359 also completed.
We now have a cross and lock

XAU/USD.. 4h chart pattern..Here's a structured breakdown of MY Gold (XAU/USD) trade setup:
XAU/USD (Gold) Buy Setup
Entry (Buy): 3350
Stop Loss: (not specified – important to manage risk)
Targets:
🎯 1st Target: 3435
🎯 2nd Target: 3505
Potential Gain
To 1st Target: 3435 − 3350 = +85 points
To 2nd Target: 3505 − 3350 = +

Will Gold drop to 3200 zone next week?🟡 1. What happened last week with Gold (XAUUSD)
Gold began last week by testing the 3350 resistance zone, hinting the end of the correction and the potential for an upside breakout.
However, in the following days, the market reversed aggressively, reaching as low as 3250 on Thursday — a drop of

HelenP. I Gold will drop to support level from pennant patternHi folks today I'm prepared for you Gold analytics. The chart started with a strong impulse move upward from the support zone around 3190 - 3205, where buyers stepped in and pushed the price aggressively higher. This bullish momentum continued until the price reached the trend line, which had previo

XAU/USD..4h chart pattern.My analyzing a bullish breakout in gold (GODL) and considering a buy entry at *3355* with two target levels: *3435* and *3500*.
### *Trade Plan Summary:*
- *Entry:* Buy at *3355* (after trendline breakout confirmation)
- *Target 1:* *3435* (~2.4% gain)
- *Target 2:* *3500* (~4.3% gain)
- *S

See all futures ideas
News didn't load
Looks like that didn't go very well. Let's try again.
AUD/USD - Triangle Breakout (02.06.2025)The AUD/USD pair on the M30 timeframe presents a Potential Buying Opportunity due to a recent Formation of a Triangle Pattern. This suggests a shift in momentum towards the upside and a higher likelihood of further advances in the coming hours.
Possible Long Trade:
Entry: Consider Entering A Long

EUR/USD CHART PATTERN.MY EUR/USD trade setup based on the 2-hour chart pattern:
🔻 Trade Type: Short (Sell)
Entry: 1.13500
Resistance (Invalidation / Strong Resistance): 1.14140
Targets:
🎯 Target 1: 1.11300
🎯 Target 2 (Final): 1.10675
⚖️ Risk-Reward Overview
Target Reward (pips) Risk (pips) R:R Ratio
1st Target 220

USD/CHF..Bearish head & shoulder pattern..Im spotting a bearish Head and Shoulders pattern on USDCHF, and it sounds like a neckline break has occurred, which is your trigger for short entry.
Let's break down the trade setup you're considering:
---
🟦 Trade Plan Summary – USDCHF Short
Pattern: Bearish Head and Shoulders
Neckline: Broken

NZDUSD Potential UpsidesHey Traders, in today's trading we are monitoring NZDUSD for a buying opportunity around 0.59400 zone, NZDUSD is trading in an uptrend and currently is in a correction phase in which it is approaching the trend at 0.59400 support and resistance area.
Trade safe, Joe.

GBPNZD Swing BuyFor this trade, I have waited for weeks. I have been impatiently waiting fro price to break below 2.25 for a while now and finally, price breaks below 2.25 on a crucial week. I want to see price go to the moon now I am watching this double bottom on D chart.

Lingrid | EURUSD Bullish Trendline Breakout. Potential LongFX:EURUSD continues to build strength above the 1.13720 resistance-turned-support line, supported by the upward channel structure. The pair is squeezing between the ascending trendline and the descending blue trendline, with higher lows signaling steady bullish pressure. A confirmed breakout above

EURO - Price can boucne up of pennant, breaking resistance levelHi guys, this is my overview for EURUSD, feel free to check it and write your feedback in comments👊
Some time ago, price entered to pennant pattern, where it at once bounced up from support line and reached $1.0850 level.
Next, it broke this level and continued to grow to resistance level, and whe

GBPUSD I Weekly CLS I Model 1 I TR Liquidity TPHey, Market Warriors, here is another outlook on this instrument
If you’ve been following me, you already know every setup you see is built around a CLS Footprint, a Key Level, Liquidity and a specific execution model.
If you haven't followed me yet, start now.
My trading system is completely

EURUSD → False breakout of resistance. Correction?FX:EURUSD is strengthening amid a decline in the dollar, but the currency pair is encountering strong resistance and forming a false breakout, which could trigger a correction.
EURUSD is testing the resistance range as part of a distribution and forming a false breakout. The market structure i

EUR/USD) Bearish breakout analysis Read The ChaptianSMC trading point update
Technical analysis of EUR/USD on the 1-hour timeframe, likely projecting a short-term downward move. Here’s a breakdown of the technical analysis and the trade idea:
---
Key Elements in the Chart:
1. Bearish Rejection from Resistance:
Price was rejected twice near t

See all forex ideas
| - | - | - | - | - | - | - | ||
| - | - | - | - | - | - | - | ||
| - | - | - | - | - | - | - | ||
| - | - | - | - | - | - | - | ||
| - | - | - | - | - | - | - | ||
| - | - | - | - | - | - | - | ||
| - | - | - | - | - | - | - | ||
| - | - | - | - | - | - | - |
News didn't load
Looks like that didn't go very well. Let's try again.
Trade directly on the supercharts through our supported, fully-verified and user-reviewed brokers.


